Join Convergence, a movement among startup technical founders & operators who are done with scattered tactics & ready to install the growth systems, decisions & leadership that move revenue.
The 10:1 burn ratio investors wince at (your spreadsheets won't show you this)
|
They had spreadsheets. Lots of them, Reader... Organic traffic trending (slightly) up. Demo forms capturing emails. Social metrics climbing slowly. Every vanity metric you could want, updated weekly and color-coded for executive review. What they didn't have? Enough customers. $500K annual burn. Less than $50K in revenue from fewer than 20 paying customers. A 10:1 burn ratio that would make any investor wince. When I asked to see their dashboard, the founder pulled up more spreadsheets. Not a single metric tracking how long it took to turn a lead into revenue, recover acquisition costs, or move deals through their pipeline. The diagnosis they got back from me wasn't what they expected. ... They thought they needed more leads, better targeting, bigger ad spend. But the real problem was, unfortunately, much harder to solve.
The problem wasn't actually demand, it was conversions... and their spreadsheets were simply hiding that fact. So, I asked for three numbers. They did not have any of them. The Three GTM Benchmarks That B2B SaaS Companies Must TrackThese days, B2B SaaS companies face CAC up 14% to $2.00 per new ARR dollar and median growth rates down to just 26%. (that's according to Benchmarkit's latest). Clearly efficiency is a necessity at this point... Three metrics separate companies that are building sustainable growth vs those that are burning cash based on high hopes. Those metrics:
1. Time-to-First-RevenueTime-to-first-revenue measures how fast you convert a lead into a paying customer directly impacts your ability to reinvest in growth. Benchmarks by segment:
Companies that shorten cycles to 30–45 days see a 38% increase in pipeline velocity. Customers who hit value within the first 14 days are 3× less likely to churn within 90 days. What this actually tells you: If your time-to-first-revenue is above benchmark, you probably do not have a lead volume problem. You likely have one of these three problems:
Biggest obstacles here are:
Rule: If time-to-first-revenue is above benchmark, do not buy more leads. Fix the conversion problem first. 2. CAC Payback PeriodThis measures how long it takes to recover customer acquisition costs. Benchmarks:
Here's a common mistake startups make... they scale a GTM channel before validating CAC payback. By the time they measure it, payback is 18 months in a segment where the market standard is 8. You see my point?
Rule: If CAC payback is unknown or above benchmark, do not scale the channel. Fix the motion first, or kill it. Here's a step-wise breakdown for how it should be done:
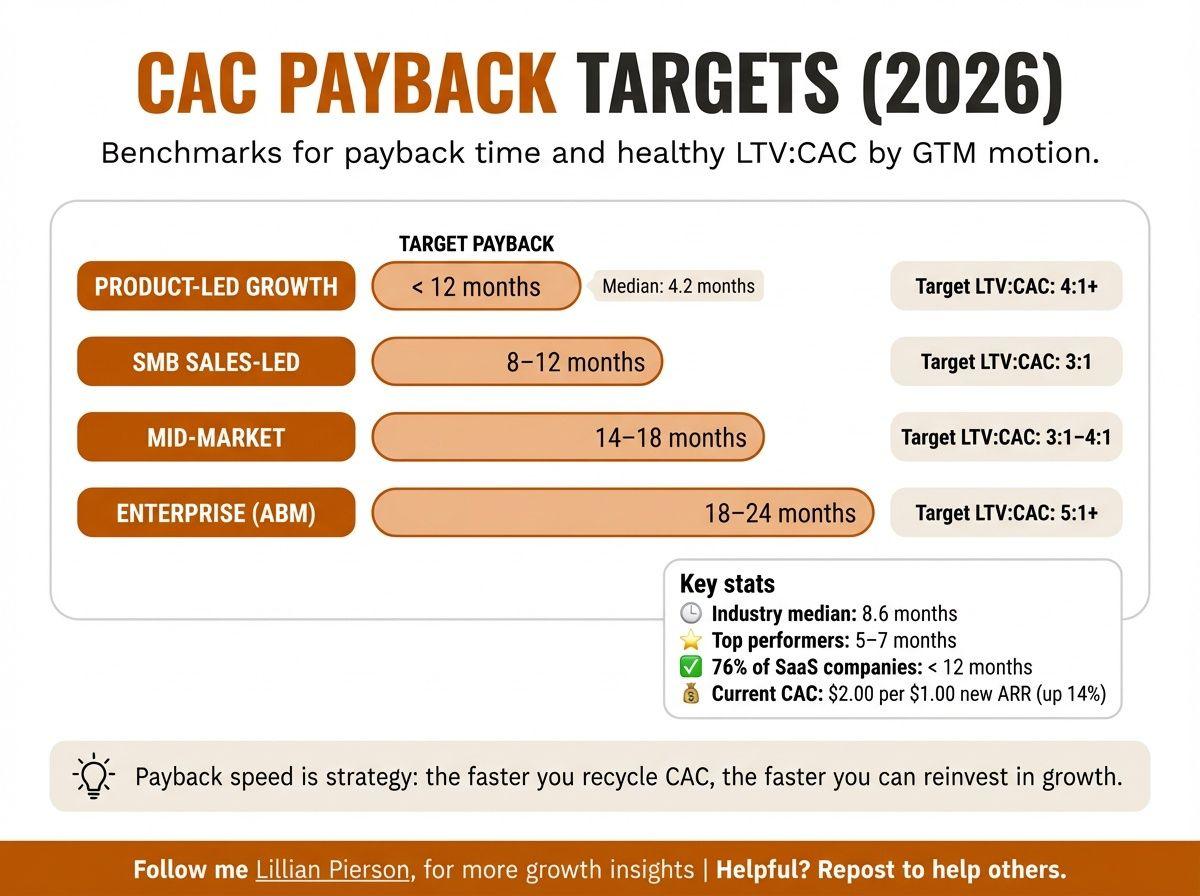
If it misses the target, kill it and move on. Now let's look at target payback period per motion...
In 2026, your target payback periods per motion should be:
What to do about it: If you're not hitting your payback period targets, here's what you can do about now, without having to start a whole new analytics project: The 7-day CAC payback validation checklist
Enterprise companies can afford longer payback periods because churn is often lower and LTV is higher. But remember, enterprise Time-to-First-Revenue is often 170+ days. 3. Pipeline VelocityThis is your leading indicator. It predicts what happens tomorrow, and is not a descriptive insight about what happened last quarter. Formula: Median B2B SaaS benchmarks are:
Companies tracking pipeline velocity weekly report: 34% annual revenue growth (vs. 11% for irregular tracking) 87% forecast accuracy (vs. 52%) What this actually tells you: If pipeline velocity is flat or declining, adding more leads often just creates more noise. The fix is usually inside the funnel. Levers that can move quickly:
What to do about it to operationalize: 7-day pipeline velocity tune-up checklist
Rule: If pipeline velocity is not improving, do not scale top-of-funnel. Fix the constraint first. What to Do NextI've given you a lot to digest here, and you may be skeptical of the numbers I've reported (if so, see the full article for sources) But, if you're ready to take action now, here's how you can get started... Compare your current metrics to these 2026 benchmarks. Identify which GTM motion currently performs best for your segment, and double down there (while stepping back from lesser performing plays) The companies who will win in 2026 aren't necessarily the ones that are executing more tactics. Winning in 2026 comes down to measuring better and building efficient systems faster. For the complete breakdown, including industry-specific benchmarks, strategies to improve all three metrics simultaneously, and the role of AI and RevOps in GTM efficiency read the full article here.
All the best, Lillian Pierson Growth Partner & Fractional CMO |
CONVERGENCE
Join Convergence, a movement among startup technical founders & operators who are done with scattered tactics & ready to install the growth systems, decisions & leadership that move revenue.